This post is sponsored by Open Campus at The New School, which offers continuing education from the university where progressive minds come together.
Picture this. You’re a recent (or not-so-recent) graduate with a creative degree. When you’re navigating the job market, you might find yourself veering away from the alluring tech jobs you’ve heard so much about.
Or—picture this alternative. You’re mid-career in a certain field, but you’re looking to make a transition into a job where you can utilize your creativity more often. With that goal in mind, you’re also steering clear of tech-heavy roles.
If you’re doing either of these things, stop right now! There are seriously lucrative jobs in technology that not only welcome creative talents, but hinge entirely on creativity, flexibility, and a visual mind.
Technology IS Creativity
Many of us operate under the misconception that technology requires vast technical and analytical skills. While, yes, that’s true, there is the other side of technology to seriously consider.
Technology is inherently creative. It always has been. In fact, technology relies on creativity, in the ability to problem-solve and to find new solutions for old pain points. Every day, there arise new technology-based solutions to old problems—and the companies behind them need creative minds to develop, perfect, create, and market these products and services.
While STEM (science, technology, engineering, and math) experts can answer questions around “What does it do?”,
some companies are looking for skilled employees in STEAM (spoiler alert: the “A” stands for art) to answer the question “What does it mean?”
New roles are constantly emerging. Increasingly, these roles require a convergence of
technology and creativity skills. By building upon your existing skill sets and thinking creatively about building new ones, you can empower yourself to be well-equipped for the jobs of today—and tomorrow.
Lucrative Creative Skills + How They Translate to Technology
Whether you’re looking to develop your creative skill set or develop new competencies, chances are that they can (and will) transfer into a career in tech. Let’s explore some of those careers—and the creative skills they require.
Designers face a unique challenge as technology and design have become more intertwined than ever before. Designers need to combine their design expertise, including core design competencies, with collaborative skills. Rather than designing something aesthetically appealing and static, today’s designers are increasingly responsible for everything from the design stage all the way through implementation and user testing.
User-Centered Design
Any app, service provider, or website is only going to be as successful as its design.
Specifically, a website or mobile application communicates its purpose through
User Experience Design (UX/UI)—including its accessibility, navigability, ease of use, and clarity.
That’s why UX skills are so important. UX design begins in a research and discovery phase, followed by brainstorming solutions, prototyping, and lastly (but certainly not least) a testing phase to ensure that products and services offer a streamlined and user-friendly experience.
UX Design involves many other creative strengths besides design prowess. They include:
- Analytical Skills
- Empathy
- Logic
- Coding Knowledge
- Strategy
- Critical Thinking
Open Campus at The New School offers a cutting-edge online certificate in
User-Centered Design (UX/UI). This certificate has courses developed by active industry practitioners that explore the process of UX, the latest emerging technologies, and the requisite current industry tools and techniques used for UX design.
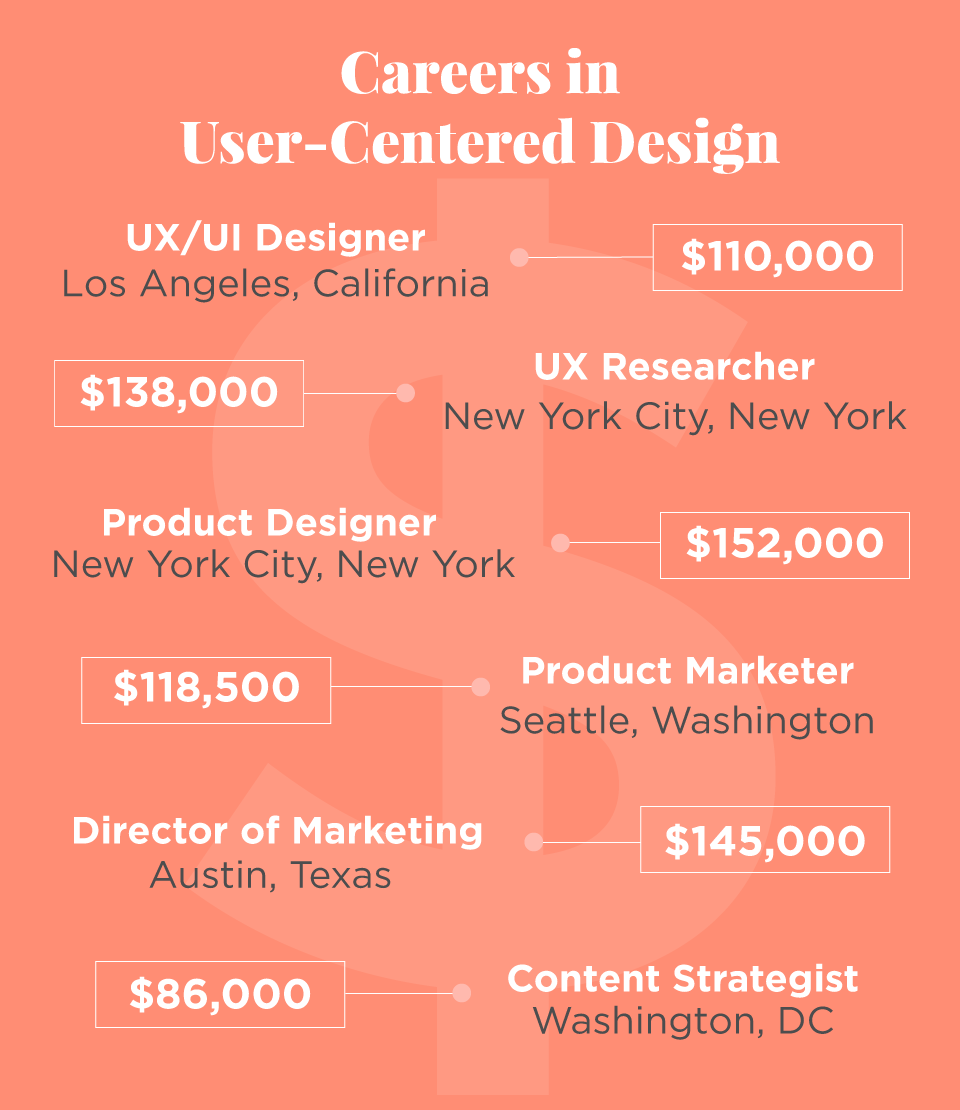
Careers in User-Centered Design
Since user-centered design involves a comprehensive combination of both hard skills and soft skills, this particular competency opens a variety of options for a career. For example, one can take UX/UI design skills directly into a UX/UI Design job role—or you can use the strong skill sets you’ve developed to your advantage in a marketing or strategy role. Here are some roles that require user-centered design—plus
examples of real salaries earned in each role.
UX/UI Designer
The Salary Project™ Real Salaries:
- $94,000, New York City, New York
- $110,000, Los Angeles, California
- $105,000, Austin, Texas
- $60,000, Fort Lauderdale, Florida
- $70,000, Chicago, Illinois
UX Researcher
The Salary Project™ Real Salaries:
- $78,300, Detroit, Michigan
- $125,000, San Francisco, California
- $80,000, Philadelphia, Pennsylvania
- $62,500, Easton, Connecticut
- $138,000 New York City, New York
Product Designer
The Salary Project™ Real Salaries:
- $152,000, New York, New York
- $90,000, Washington, DC
- $110,000, San Francisco, California
- $81,000, Minneapolis, Minnesota
- $97,000, West Hartford, Connecticut
Product Marketer
The Salary Project ™Real Salaries:
- $118,500, Seattle, Washington
- $102,000, Charlotte, North Carolina
- $85,000, Boise, Idaho
- $80,000, Jersey City, New Jersey
- $82,000, San Diego, California
Web Designer
The Salary Project™ Real Salaries:
- $83,000, Chicago, Illinois
- $75,000, Brooklyn, New York
- $90,000 Boulder, Colorado
- $62,000, Miami, Florida
- $72,000, Philadelphia, Pennsylvania
Director of Marketing
The Salary Project™ Real Salaries:
- $120,000, Boston, Massachusetts
- $110,000, Salt Lake City, Utah
- $130,000, Ann Arbor, Michigan
- $120,000, New York City, New York
- $145,000, Austin, Texas
Content Strategist
The Salary Project™ Real Salaries:
- $60,000, Charlotte, North Carolina
- $58,000, St. Louis, Missouri
- $86,000, Washington, DC
- $85,200, Stanford, California
- $58,000, Atlanta, Georgia
Infographics and Data Visualization
Has there ever been a time where you were trying to explain a complicated problem or idea only to resort to drawing it on a piece of paper? If so, you can probably relate to the importance of data visualization in, well, pretty much any job capacity.
Data visualization and infographics are the means with which you explain, dilute, or tell stories that would otherwise require the dissemination of thousands (even millions) of pieces of data.
That’s why
infographics and data visualization are crucial in technology. Rather than poring for hours over gigantic data sets or never-ending spreadsheets, data visualization and infographics, when created effectively, communicate everything in a single image or a set of graphics. But how?
Our eyes are naturally drawn to colors and patterns. Data visualization is a form of digital art used to translate big data into bite-sized, digestible pieces of visual content. Data visualization brings raw data to life with creative storytelling, visual representation, and in-depth analytics.
Some examples of commonly-used data visualization include:
- Graphs
- Charts
- Heat maps
- Tables
- Matrixes
- Scatter maps
- Word clouds
- Histograms
Open Campus at The New School offers an online certificate in
Infographics & Data Visualization that gives students a look at the tools, programs, and best practices of the craft of data visualization. We’re speaking from experience, too, as members of our team have
taken this course—and applied it to data visualization of our own!
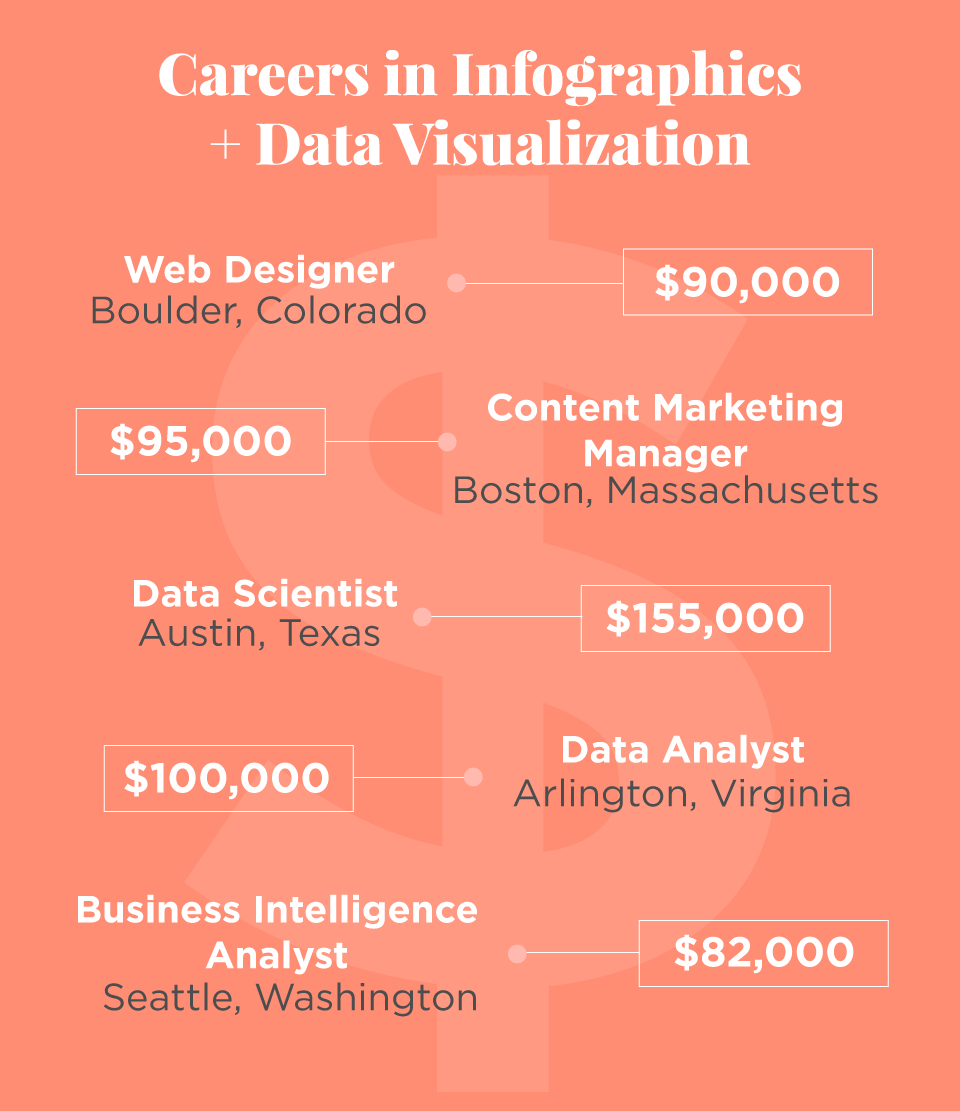
Careers in Infographics and Data Visualization
Here are just a few roles that require (or are amplified by) strong data visualization and infographic skills—plus
examples of real salaries earned in each of these roles. We also
co-hosted a webinar with The New School to go even more deeply in detail on how data visualization can amplify your career.
Web Designer
The Salary Project™ Real Salaries:
- $83,000, Chicago, Illinois
- $75,000, Brooklyn, New York
- $90,000 Boulder, Colorado
- $62,000, Miami, Florida
- $72,000, Philadelphia, Pennsylvania
Content Marketing Manager
The Salary Project™ Real Salaries:
- $85,000, Los Angeles, California
- $95,000, Boston, Massachusetts
- $70,000, Orange, California
- $80,000, Denver, Colorado
- $70,000, Nashville, Tennessee
Data Scientist
The Salary Project™ Real Salaries:
- $115,000, Austin, Texas
- $110,000, Cleveland, Ohio
- $85,000, Alpharetta, Georgia
- $105,000, Baltimore, Maryland
- $155,000, Seattle, Washington
Data Analyst
The Salary Project™ Real Salaries:
- $81,600, Washington, DC
- $60,000, Denver, Colorado
- $70,000, Portland, Oregon
- $80,000, Santa Monica, California
- $100,000, Arlington, Virginia
Business Intelligence Analyst
The Salary Project™ Real Salaries:
- $69,000, Minneapolis, Minnesota
- $68,500, Roswell, Georgia
- $65,000, Burlington, Vermont,
- $72,000, Omaha, Nebraska
- $82,000, Seattle, Washington
Looking to advance your creative skill sets?
The New School’s Open Campus offers a variety of noncredit certificates and classes in a wide variety of fields. These fields include data visualization, design thinking, graphic & digital design, journalism, management, entrepreneurship for social impact, and business intelligence.
The New School’s Open Campus offers small class sizes, which allow students to work closely with peers and instructors to gain personalized feedback and input, as well as online or on-campus options to maximize flexibility.
Take a look through The New School’s Open Campus’
course listings to find the right class for you—one that gives you the opportunity to complete a certificate with real results and tangible work for your portfolio.
This post is sponsored by Open Campus at The New School, which offers continuing education from the university where progressive minds come together.


